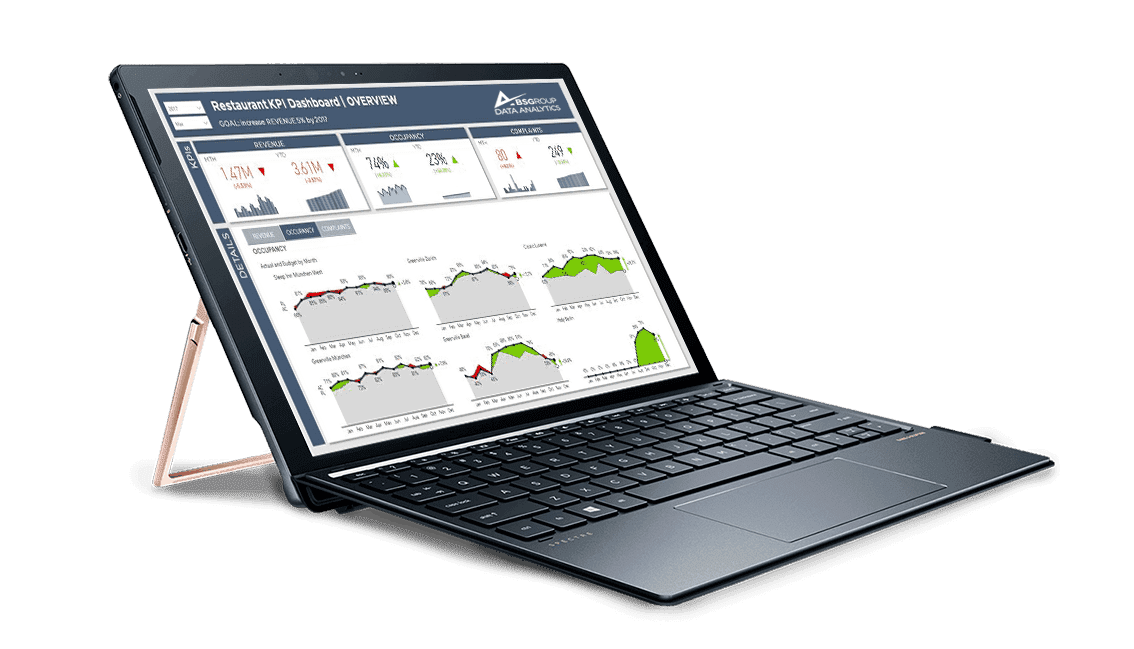
Data Visualization
Turning data into profitable information and insights
With a consistent notation, everyone speaks the same language – company-wide!
If the company data and key performance indicators are not presented in a consistent manner within your company and, in particular, if unsuitable graphics are used to interpret the figures, this often leads to confusion in interdepartmental cooperation. What you need are clear rules. Because only then you can turn your data into meaningful insights and information.

Data visualization with BSgroup Data Analytics

We help you to reduce complex issues to the essentials by using adequate data visualization tools and to standardise your reporting by means of report notations.
For this, we use standard notations, such as those from IBCS (International Business Communication Standards), but also the right tools, such as Power BI or XLCubed, with which we can build dynamic reports and dashboards for proper data storytelling.
«To help you keep track of your data, we rely on best practices in data visualization and provide you with a recipient-specific visualisation solution.«
Roger Unholz, Partner
